Part 4 - Visualization - People Counter Axis/ThingsBoard
In part 3 we configured the rule chain which creates the data we need in this part (4). Now we will focus on the visualization part and build two dashboards to visualize the data that we now have access to.
The dashboards will be as:
- One which is a simple real time STOP/GO dashboard which can be shown on a display in the office/floor/store itself.
- One which will provide more information and statistics which is intended to be used by other types of personnel like those who are planning staffing for a store or those who are planing and maintaining office spaces.
GO/STOP dashboard
The first dashboard that I have created is a simple GO/STOP dashboard that shows “GO” in green if currentOccupancy is below maxOccupancy. If the currentOccupancy is above maxOccupancy the background turns to red, and it says “STOP” instead. This dashboard fully event based and updates its data in realtime. It is a web page which is intended to run in full screen on a display/monitor in the store/office.

Statistics dashboard
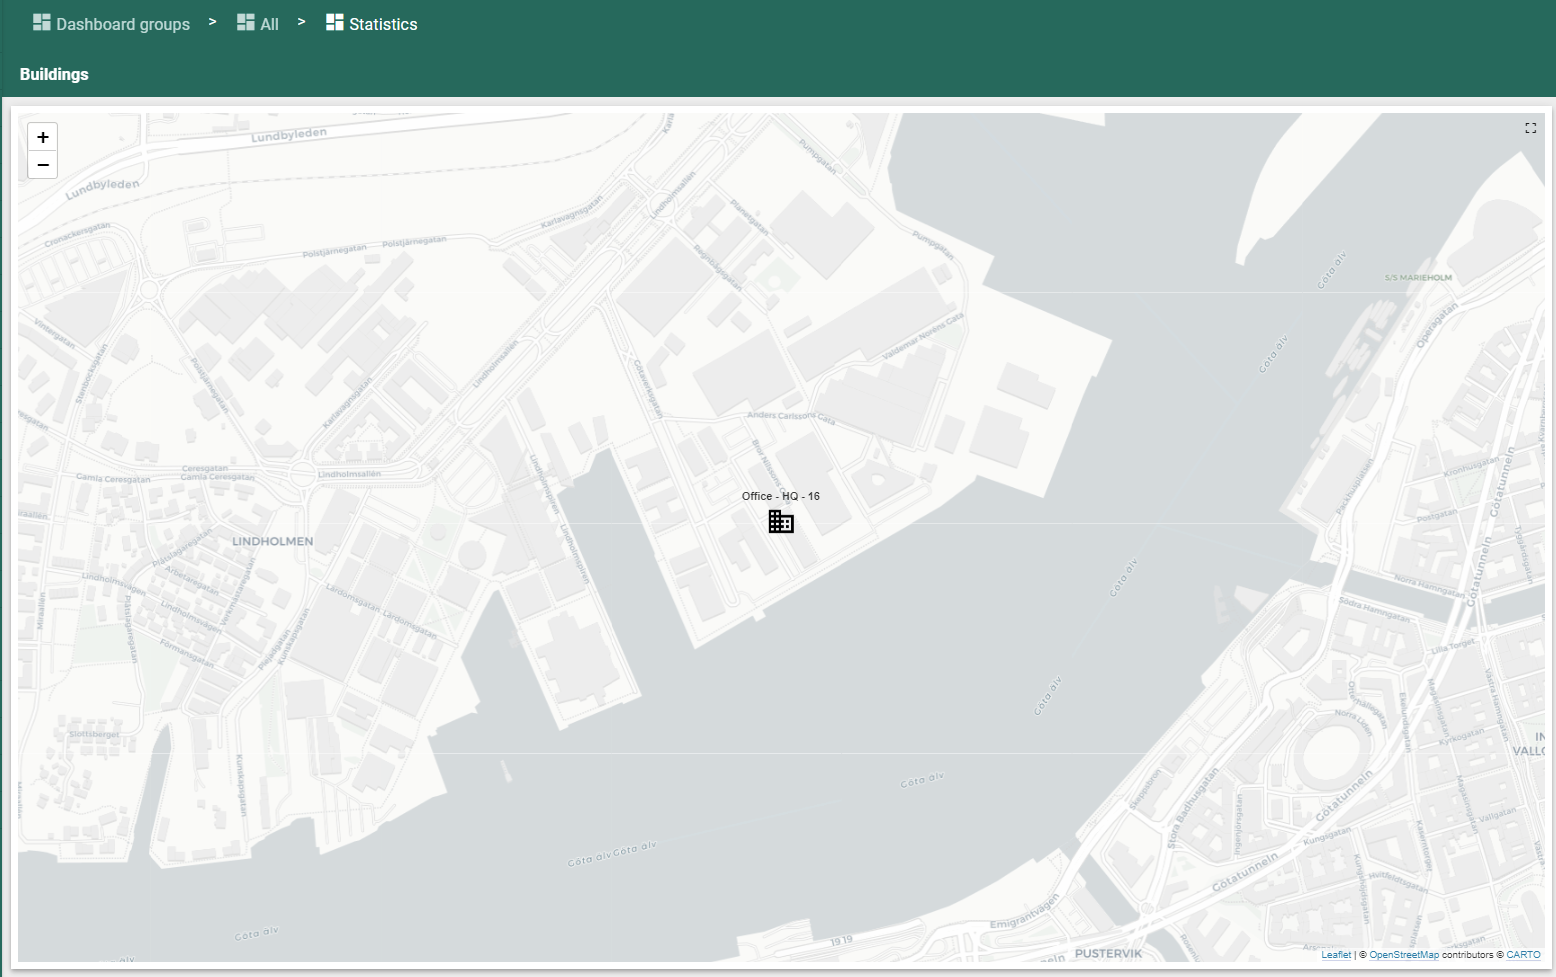
The statistics dashboard shows a map, in which all the buildings are mapped based on the longitude/latitude metadata added on the building asset. The number above the building icon is the current occupancy number for all floors combined in that building.
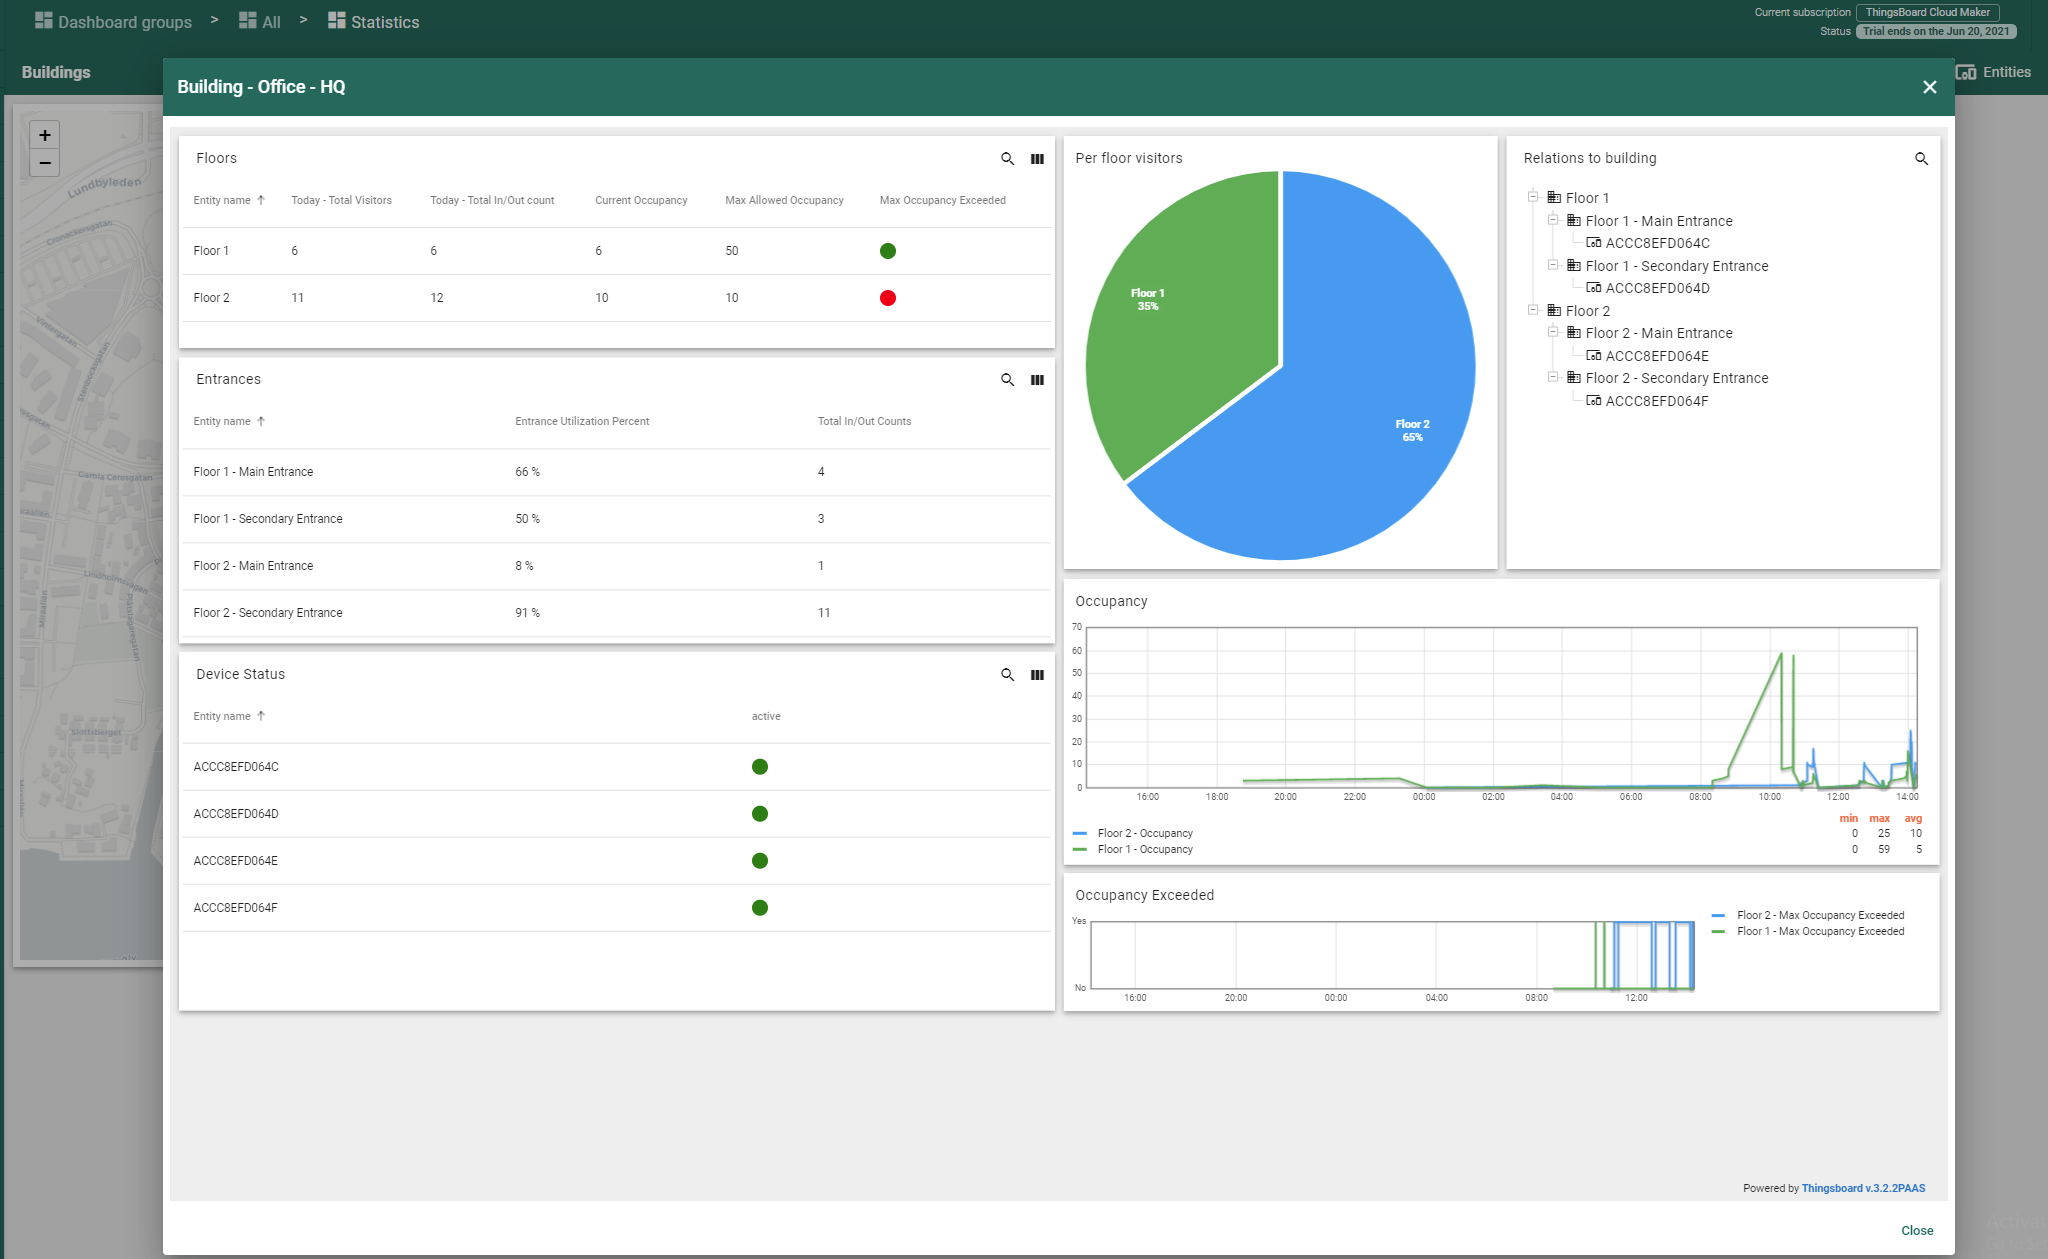
When clicking a building (we only have one in this example), a new dashboard popup is displayed in which I have added some charts and cards to display statistics on the data we received from the devices, and data that we created thru the rule chains.
This dashboard also shows if devices are online/offline based on their LWT MQTT message. It shows Occupancy graphs as well as graphs for when occupancy was above the maximum allowed number.
We can also see how the relation tree looks like, all the way from the building > floor > entrance > device which helps us to verify that all relations are configured correctly.
Conclusion
This was the final part in this blog series.
My idea when creating this series was to show how easy it can be to build a IoT solution with components that are available “out of the box”.
In this blog post we configured the Axis cameras to send its data on MQTT as Event’s. The Axis devices however has built in functionality to send its data on an interval instead of realtime. When using intervals, Axis will keep the history on the device itself until it knows that it successfully was received by the recipient. In this MQTT approach each In/Out count is only sent once and will not be resent if lost.
This specific use-case can also be expanded to contain data from more sources/devices. - Let’s say that you want to track Co2 or sound levels in the same Office, then it might be interesting to know how many people it was in the office/room when the Co2 went from good to bad for example.
ThingsBoard as an IoT platform can handle a lot of different use-cases since it can integrate with HTTP, MQTT, Azure, AWS and with the help of gateways for MODBUS, SNMP etc.
I hope that you found this blog series interesting!